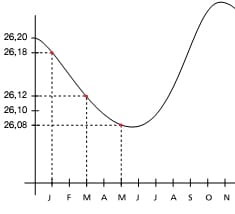
| The graph on the left shows the change in size of a crack over a year. The cause of such a change could be poor seating of the foundations on a clay soil.
In this case, between the months of January and March there was a change of 0.6/10th of a mm. (1.8 read in January, minus 1.2 read in March = 0.6/10th of a mm).
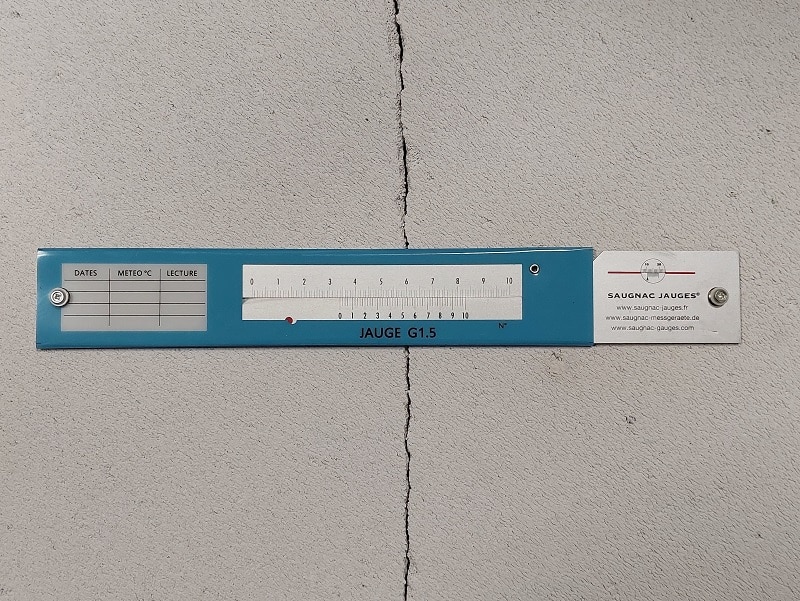
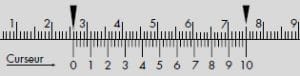
The G1 gauge, the precision of which is 1/10th of a mm, cannot assess the change in closure of the crack over this period.
It would be necessary to wait till May to make a judgement and read a change of 1/10th of a mm. (1.8 read in January, minus 0.8 read in May = 1/10th of a mm)
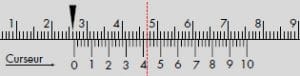
In a minimum of time, with the more precise G1.5 gauge a change of 0.6/10th of a mm, i.e. 6/100th of a mm can be detected, and the fact that the crack is tending to close.
Conclusion: observation time is halved |